
If we grow bacteria in culture, a predictable pattern of growth in a bacterial population occurs. We can represent this pattern in a graph as the number of living cells in a population over time. This graphical representation is known as a bacterial growth curve. The most common means of bacterial reproduction is by binary fission. They grow at an exponential rate (2n, n=no. of cells) as one cell gives rise to two progeny cells. For example:
- 2n =21 =2 (one cell give two daughter cells)
- when n is 2, 22 =4 (two cells give four daughter cells)
- 23=8 (3 cells give eight daughter cells) and so on.
Thus, 1 bacterium will produce 8 bacteria after 3 generations.
Generation time/doubling time
The time interval between two cell division under optimum condition is known as the generation time or population doubling time. The doubling (generation) time of bacteria ranges from as little as 20 minutes for E. coli to as long as 18 hours for Mycobacterium tuberculosis. The exponential growth and the short doubling time of some organisms result in the rapid production of very large numbers of bacteria. For example, 1 E. coli organism can produce over 1000 progeny in about 3 hours and over 1 million in about 7 hours.
The doubling time varies not only with the species, but also with the number of nutrients, the temperature, the pH, and other environmental factors.
The Bacterial growth curve
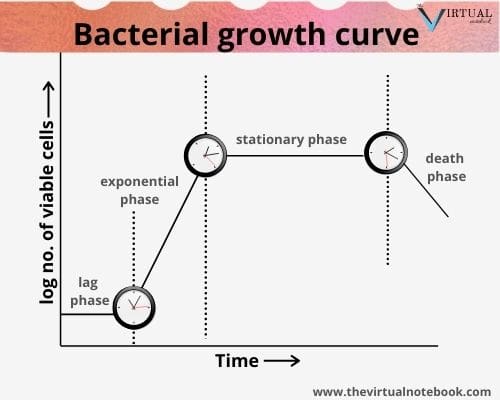
When we inoculate a bacterium into a suitable liquid culture medium and incubate it, its growth follows a definite course. When a bacterial count of such culture is determined at different intervals and plotted in relation to time, a bacterial growth curve is obtained. It comprises four phases: lag phase, exponential, stationary and death phase. We will discuss each phase in detail in this article.
Bacterial growth curve phases
The phases of the bacterial growth curve are reflections of the events in a population of cells. The bacterial growth curve has following four phases:
1. Lag phase
The first phase is the lag phase, during which vigorous metabolic activity occurs but cells do not divide. However, cells in the culture are synthesizing new components. During the lag phase, bacteria simply synthesize RNA, enzymes and other metabolites that are missing in their new environment. Moreover, the cells increase in size due to the accumulation of enzymes and metabolites. At the end of the lag phase, the cells reach their maximum size.
The duration of the lag phase varies with the species, size of the inoculum, nature of culture medium and environmental factor such as temperature. However, this can last for a few minutes up to many hours.
2. Exponential phase/ log phase
Following the lag phase, the cells start dividing and their numbers increase exponentially with time. It shows a linear curve in the graph as the growth rate is maximum. The exponential phase is also known as the log phase. The population is healthiest and most uniform in terms of chemical and physiological properties during this phase.
The exponential phase is characterized by a period of the exponential growth—the most rapid growth possible under the conditions present in the batch system. During exponential growth, the rate of increase of cells
in the culture is proportional to the number of cells present at any particular time.
3. Stationary phase
It is the third phase of the bacterial growth curve and is the phase of no net growth. After the log phase, the bacterial growth ceases almost completely due to exhaustion of nutrients, accumulation of toxic products and autolytic enzymes. During this phase, the number of cells formed is equal to the number of cells that die. Hence, the viable count remains stationary as an equilibrium exists between the dying cells and the new cells. The result is a “smooth,” horizontal linear part of the curve during the stationary phase. This phase is prone to mutations. The spore-forming bacteria start producing endospores and other decreases somewhat in overall size.
Reason why batch culture reaches stationary phase:
- Exhaustion of energy source and essential nutrients.
- A buildup of waste product to a point where they start to inhibit cell growth
As a result of this nutrient stress, stationary phase cells are generally smaller and rounder than cells in the exponential phase.
4. Death phase
The last phase of the bacterial growth curve is ‘death phase‘ or decline phase. It is marked by a decline in the number of viable bacteria. During this phase, the total count of bacteria may remain constant but the viable count decreases. Undoubtedly, a variety of conditions contribute to bacterial death. The most important factors are:
- the depletion of essential nutrient
- accumulation of inhibitory products, such as acids.
During the death phase, the number of viable cells decreases exponentially. If you relate closely, you will find that the death phase is just the inverse of the log phase. Although, the death rate is slower than the growth rate.
Bacterial growth curve calculations
During the exponential phase, each microorganism is dividing at constant intervals. Thus, the population doubles in number during the generation (doubling) time.
For determining generation time,
Let’s assume, N0 = the initial population number
Nt = the population at time t
n = the number of generations in time t
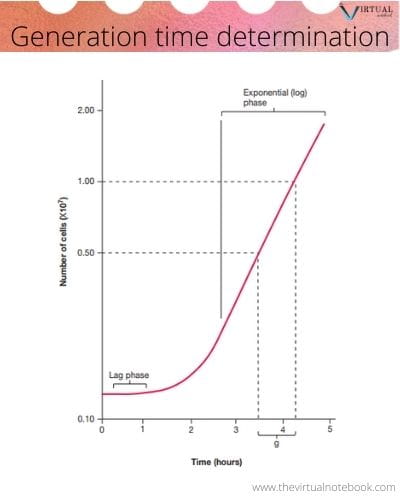
From the graph, we can say that
Nt = N0 x 2n
Solving for n, we have
log10Nt = log10N0 + nlog102
or, nlog102 = log10Nt – log10N0
for value of n, we can write it as
n = (log10Nt – log10N0)/log102
If we substitute the value of log102 in the above equation, we can simplify the equation to
n = (log10Nt – log10N0)/0.301 , (value of n is 0.301)
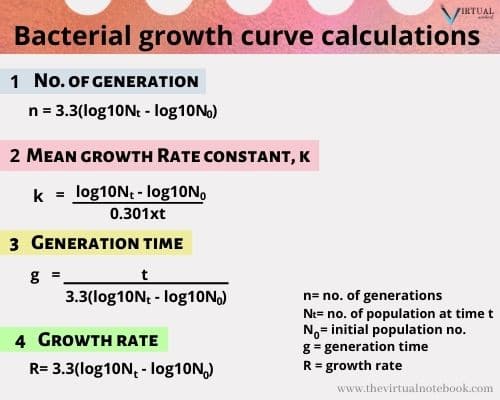
or, n = 3.3(log10Nt – log10N0) (EQUATION 1)
From the above equation, we can calculate the number of generations.
For calculating mean growth rate constant
The rate of growth during the exponential phase in batch culture can be expressed in terms of the mean growth rate constant (k). This is the number of generations per unit time, often expressed as the generations per hour.
k = n/t
by substituting the value of n from above equation, we will get
k = [(log10Nt – log10N0)]/(0.301xt) (EQUATION 2)
For calculating generation time
The generation time g (the time required for the population to double) can be determined from the number of generations n that occur in a particular time interval t.
g = t/n
g = t/3.3((log10Nt – log10N0) (from equation 1) EQUATION 3
The generation time is not the same for a particular species under all conditions. It is strongly dependent upon the nutrients in the medium and on prevailing physical conditions.
For calculating growth rate
During exponential growth, the growth rate (number of generations per hour) is the reciprocal of the generation time g. It is denoted by symbol R. It is also the slope of straight line obtained when the log number of cells is plotted against time
R = n/t
From equation 1, we can say
R= 3.3(log10Nt – log10N0) EQUATION 4
From the above equations, we are able to calculate:
- Number of generations (equation 1)
- Mean growth rate constant (equation 2)
- Generation time (equation 3)
- Growth rate (equation 4)
Sources and links
Essential of Medical microbiology by Apurba Sankar Sastry and Sandhya Bhat K, Jaypee Brothers Medical Publishers (P) Ltd, section 1, chapter 2: Morphology and Physiology of Bacteria
Review of Medical microbiology and immunology, fourteenth edition by Warren Levinson, Basic bacteriology, chapter 3: Growth
Cell Biology, Genetics, Molecular Biology, evolution and Ecology, P.S. Verma, S chand publications
Ananthanararyan and Paniker’s textbook of microbiology, seventh edition, chapter 2: morphology and physiology of bacteria, bacterial growth curve
https://en.wikipedia.org/wiki/Bacterial_growth
Thanks for the information. Well explained.
If Equation 4 is the reciprocal of Equation 3, it needs to be divided by time. This would also make it into a rate. So
Eq. 4: R = 3.3(log10Nt – log10No) / t
Correct?